Cosine Similarity Tests
An Explanation of Cosine Distance
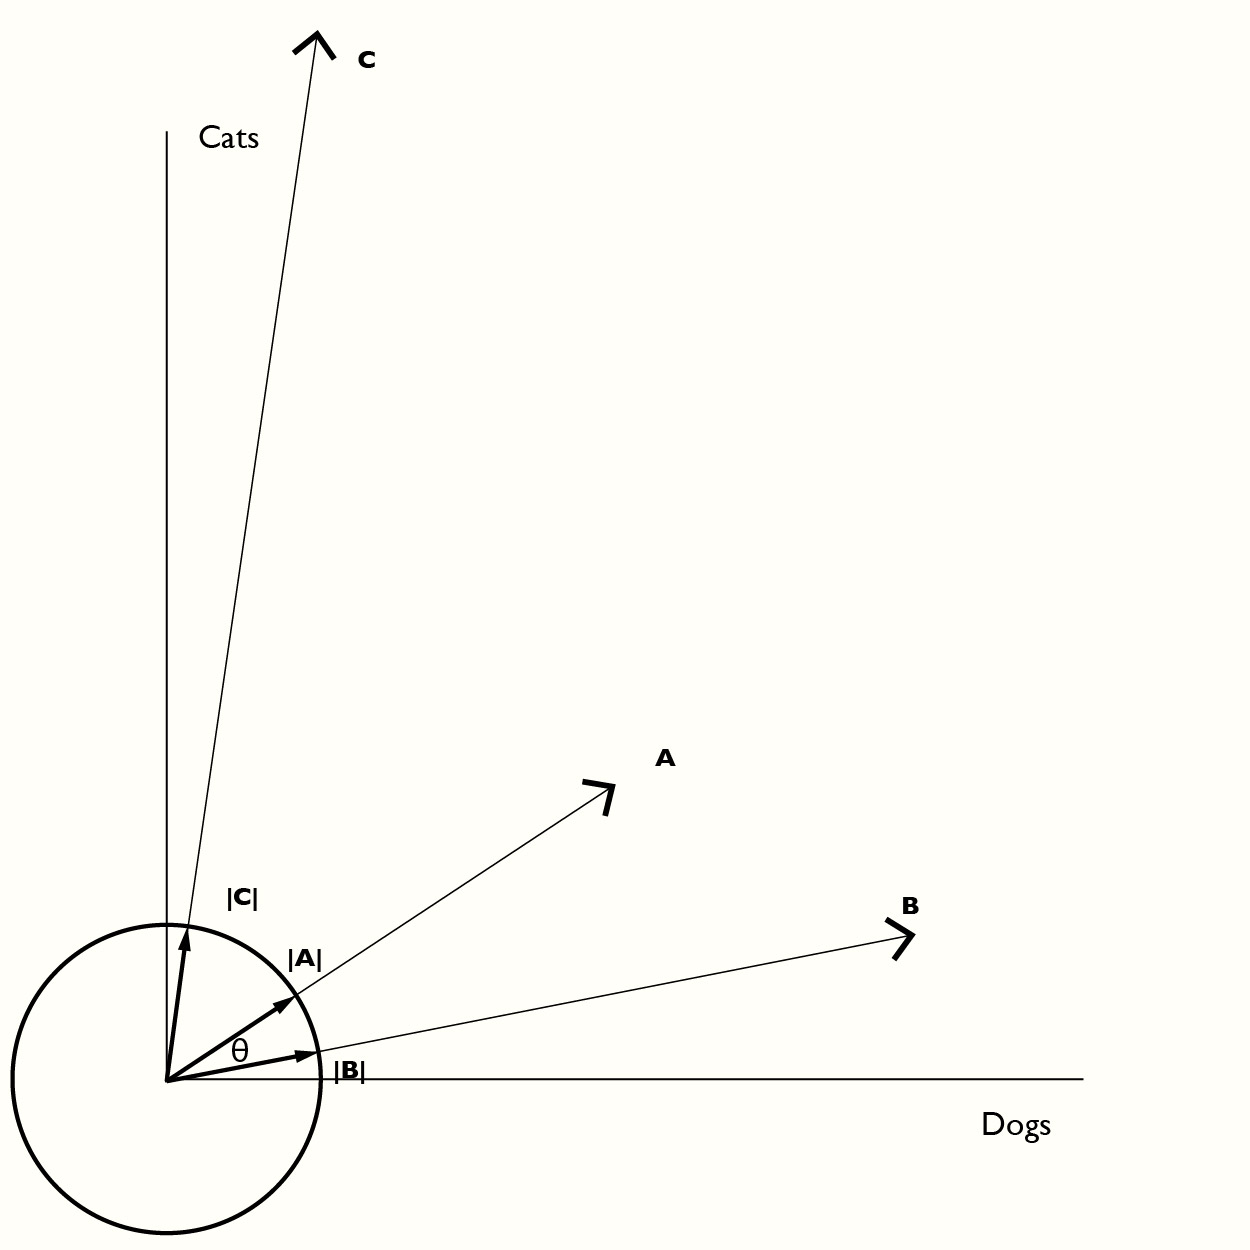
If you are unfamiliar with the cosine distance metric here’s an intuitive explanation.
Suppose we want to see how close two sets of numbers are to each other. For example house A has 3 dogs and 2 cats, house B has 5 dogs and 1 cat and house C has 1 dog and 7 cats. We can represent each of these as a vector:
A = [3,2] B = [5,1] C = [1,7]
Each of these vectors can be “normalized” to a unit vector (a vector of length 1) by dividing by the vector length. Then you can take advantage of math. A vector dot-product of two vectors measures the angle between those two vectors. If we want to know if A is closer to B or C we take A . B and A . C and see which has the smallest angle between them. The dot-product generates the cosine of the angle, which is why this technique is known as the cosine distance metric.
Test of the Cosine-Distance Algorithm
This page tests the Cosine Distance Algorithm for sorting a 2 dimensional matrix.
The algorithm basically compares distances between two vectors by the cosine of the angle between them. From that we can create a sorting algorithm where vectors are matched with their closest neighbor. By sorting on columns, and then rows, the entire matrix can be sorted/clustered.
This page tests the algorithm by first creating an image with a recognizable, yet random, pattern, randomizing it, and then asking the cosine distance algorithm to unrandomize it.
Steps:
- Create a patterned sorted set of random data
- Disorganize the pattern by shuffling columns, and then rows.
- Use cosine similarity to reorganize/cluster it.
Create the Pattern:
Create a pattern with a small amount of random noise and then add a sorted set of gaussian random noise over the population… Graph the resulting set to see what the pattern looks like:
Code
k_num_columns = 120
k_num_rows = 60

def unit_gaussian_sample_distribution(num_samples):
    samples = sorted(np.random.randn(num_samples))
    min_sample = min(samples)
    samples = [(sample-min_sample)/(max(samples)-min_sample) for sample in samples]
    return samples

def play_that_funky_music_white_boy(peak, sigma_width, num_samples):
    uniform_distribution = np.random.rand(num_samples).tolist()
    funky_distribution = [x/5.0 for x in uniform_distribution]

    gaussian_sample_size = round(num_samples/4)
    half_gaussian_sample_size = round(gaussian_sample_size/2)
    gaussian_distribution = unit_gaussian_sample_distribution(gaussian_sample_size)
    center_index = round(peak*num_samples)
    peak_left = center_index - half_gaussian_sample_size
    gauss_left = 0 if peak_left >= 0 else (-peak_left)
    peak_right = peak_left + gaussian_sample_size
    gauss_right = gaussian_sample_size-1 if peak_right < num_samples else (gaussian_sample_size-(peak_right-num_samples))-1
    peak_left = 0 if peak_left < 0 else peak_left
    for i in range(gauss_left, gauss_right+1):
        funky_distribution[peak_left+(i-gauss_left)] += gaussian_distribution[i]

    return [uloom.clip(x,0.0,1.0) for x in funky_distribution]

funky_array = [play_that_funky_music_white_boy(y/float(k_num_rows),.2, k_num_columns) for y in range(k_num_rows)]
funky_array_df = pd.DataFrame(funky_array, columns=[f"column_{x:06d}" for x in range(k_num_columns)])
row_indices = [f"___row_{x:06d}___" for x in range(k_num_rows)]
funky_array_df.insert(loc=0, column='___row_names___', value = row_indices)
funky_array_df = funky_array_df.set_index('___row_names___')

fig = (px.imshow(funky_array_df, width=1500, height=800, title="<b>Pattern of Uniform Noise + Sorted Gaussian Noise over a Window.</b>")) #.show())
Image(fig.to_image())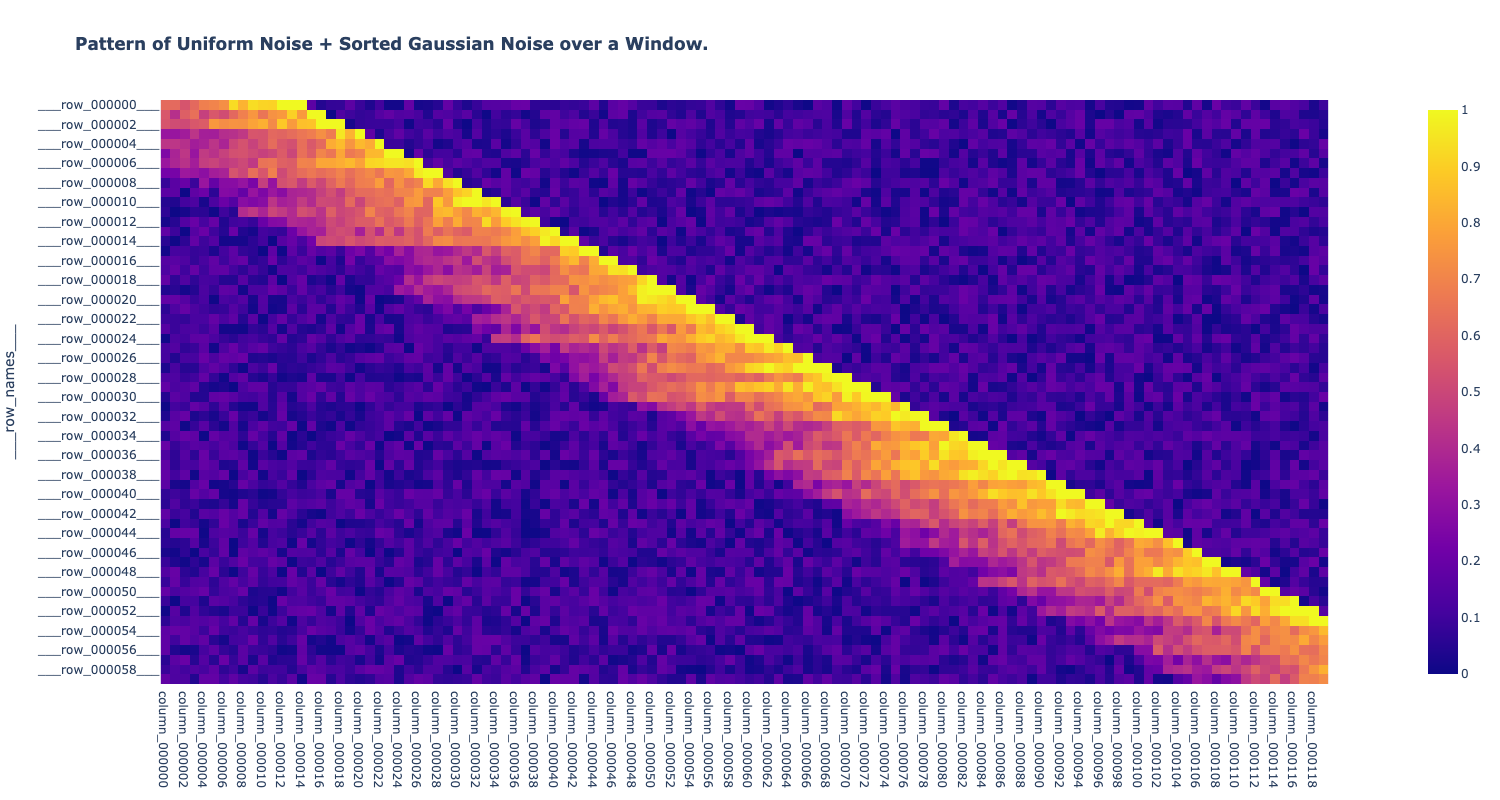
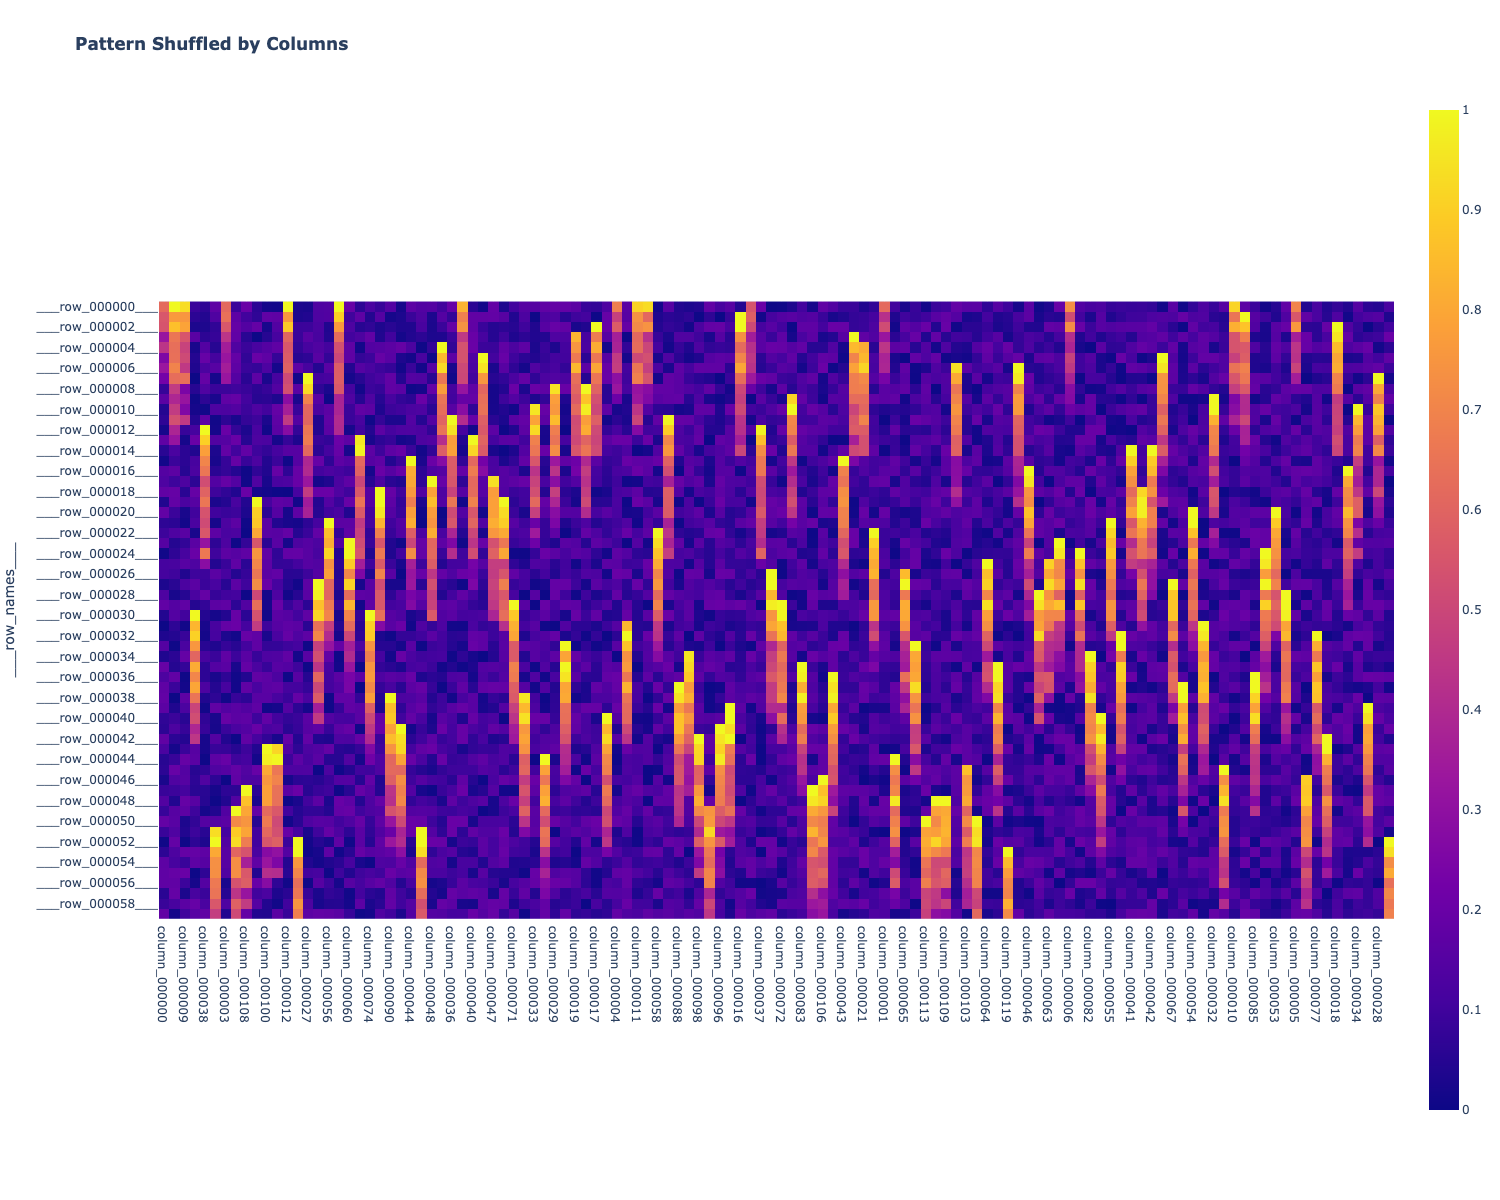
Shuffle the pattern, by Columns, then Rows
Code
Code
# Shuffle a dataframe by row
funky_row_transpose_df = funky_col_shuffled_df.T
funky_row_transpose_df.columns = [f"row_{x:06d}" for x in range(len(funky_col_shuffled_df))]
# fig = (px.imshow(funky_row_transpose_df, width=1500, height=1200).show())
colnames = funky_row_transpose_df.columns.tolist()
shuffle(colnames)
funky_row_shuffled_df = funky_row_transpose_df[colnames]
funky_row_shuffled_df = funky_row_shuffled_df.T
unsorted_df = funky_row_shuffled_df

fig = (px.imshow(funky_row_shuffled_df, width=1500, height=800, title="<b>Pattern Shuffled by Columns, then Rows</b>"))#.show())
Image(fig.to_image())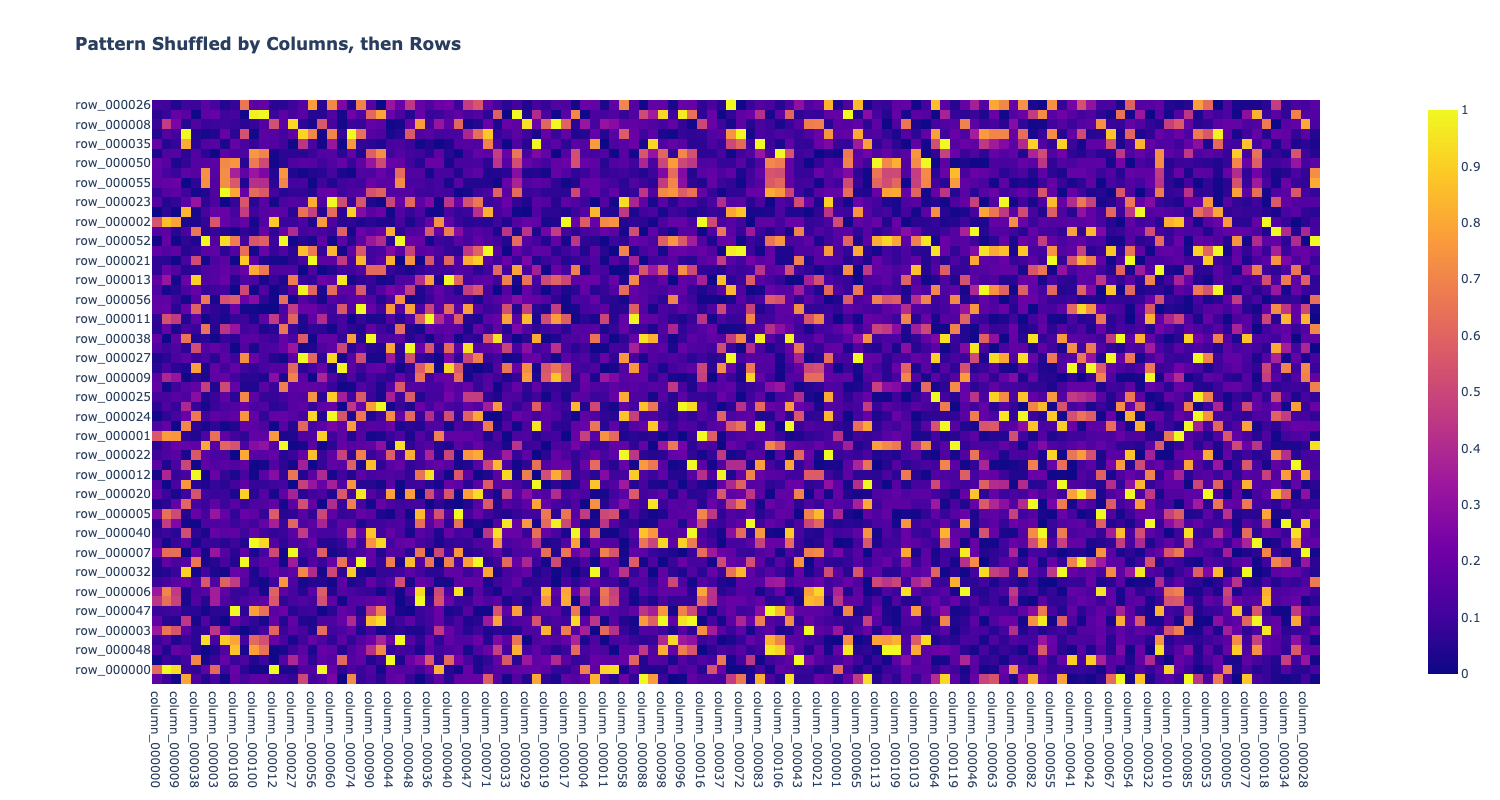
Use Cosine Similarity to Deliver A 2-Dimensionally Sorted DataFrame
The Cosine Similarity Distance Metric is used to sort the Dataframe by columns then rows. Here is the code/algorithm extracted verbatim from the Khipu FieldGuide:
Code
def as_unit_dataframe(aDataframe, columns_to_drop=None, columns_to_keep=None, axis=1):
    """ Return a dataframe with all values normalized to 1.0 """
    #axis=0 refers to operations along rows (index)
    #axis=1 refers to operations along columns.
    # Copy dataframe to a new dataframe
    unit_Dataframe = aDataframe.copy()
    if columns_to_drop is not None: unit_Dataframe = unit_Dataframe.drop(columns_to_drop, axis=1)
    if columns_to_keep is not None: unit_Dataframe = unit_Dataframe[columns_to_keep]
    if axis == 0:
        for row_index in range(unit_Dataframe.shape[0]):
            df_row = unit_Dataframe.iloc[row_index].values
            row_vector = df_row.tolist()

            unit_row = uloom.to_unit_vector(row_vector)
            unit_Dataframe.iloc[row_index] = unit_row
    elif axis == 1:
        for column in unit_Dataframe.columns:
            column_vector = unit_Dataframe[column].tolist()
            unit_column = uloom.to_unit_vector(column_vector)
            unit_Dataframe[column] = unit_column
    else:
        raise ValueError("axis must be 0 or 1")

    return unit_Dataframe

class CosineSimilarityMatrix():
    """
    Creates a dataframe, sorted by columns and or rows, using cosine similarity.
    sorted_df = CosineSimilarityMatrix(unsorted_df).sort(sort_columns=True, sort_rows=True)

    Input is a dataframe, not necessarily normalized to unit vectors, with a string index (ie. "row_000") and all numeric columns.
    Dataframe index should be a string, otherwise results are undefined.
    You may want to first pass the dataframe to utils_pandas.as_unit_dataframe(aDataframe, columns_to_drop=None, columns_to_keep=None, axis=1)
    Resulting dataframe returned is deep copy of original, in sorted column and row order

    See test_utils_pandas.py for example usage, or test_cosine_similarity.ipynb or figure_eight_knots.ipynb for a more complex example.
    """
    def __init__(self,aDataframe,  start_column=None, start_row=None):
        self.input_df = aDataframe.copy(deep=True)
        self.output_df = aDataframe.copy(deep=True)

        self.original_column_order = aDataframe.columns.tolist()
        self.start_column = self.original_column_order[0] if start_column is None else start_column

        self.index_column_name = aDataframe.index.name
        row_names = aDataframe.index.tolist()
        if len(set(row_names)) != len(row_names): # Check for duplicate row names
            uloom.log_error(f"utils_panda.CosineSimilarityMatrix(): index names must be unique! {len(set(row_names))=} != {len(row_names)=}")
            raise ValueError("utils_panda.CosineSimilarityMatrix(): index names must be unique")

        self.original_row_order = row_names
        if not all([isinstance(row_name,str) for row_name in row_names]):
            row_names = [f"___row_{x:06d}___" for x in range(len(self.normal_matrix))]
            self.input_df.insert(loc=0, column='___row_names___', value = row_names)
            self.input_df.set_index = row_names
        self.start_row = row_names[0] if start_row is None else start_row


    def sort(self, sort_columns=True, sort_rows=True):
        """ Sorts dataframe by columns, then rows. """
        # First sort by columns, then rows
        if sort_columns:
            self.output_df = self.cosine_sort_by_columns()
        if sort_columns and sort_rows:
            self.input_df = self.output_df.copy(deep=True)
        if sort_rows:
            self.output_df = self.cosine_sort_by_rows()

        return self.output_df # Now Sorted!

    def cosine_sort_by_columns(self):
        column_names = self.input_df.columns.tolist()
        normalized_matrix_df = as_unit_dataframe(self.input_df.copy(deep=True), axis=1)

        new_columns = [self.start_column]
        old_columns = [name.strip() for name in column_names if not (name in new_columns)]
        while len(old_columns) > 0:
            best_match = 0.0
            match_column = None
            match_vector = normalized_matrix_df[new_columns[-1]]
            for search_name in old_columns:
                dot_prod = match_vector.dot(normalized_matrix_df[search_name])
                if dot_prod >= best_match: # >= to ensure you match all 0.0's
                    match_column = search_name
                    best_match = dot_prod
            if match_column:
                new_columns.append(match_column)
                old_columns.remove(match_column)

        return self.input_df.copy(deep=True)[new_columns] # Return sorted dataframe (deep copy)

    def cosine_sort_by_rows(self):
        row_names = self.input_df.index.tolist()
        normalized_matrix_df = as_unit_dataframe(self.input_df.copy(deep=True), axis=0)

        new_rows = [self.start_row]
        old_rows = [name.strip() for name in row_names if not (name in new_rows)]
        while len(old_rows) > 0:
            best_match = 0.0
            match_row = None
            match_vector = normalized_matrix_df.loc[new_rows[-1]].values.tolist()
            for search_name in old_rows:
                search_vector = normalized_matrix_df.loc[search_name].values.tolist()
                dot_prod = uloom.dot_product(match_vector, search_vector, do_normalize=False)
                if dot_prod >= best_match: # >= not > to ensure you match all 0.0's
                    match_row = search_name
                    best_match = dot_prod
            if match_row:
                new_rows.append(match_row)
                old_rows.remove(match_row)

        row_sorted_df = self.input_df.copy(deep=True)
        row_sorted_df.reindex(new_rows)
        return row_sorted_df  # Return sorted dataframe (deep copy)
And it’s use in the example of the shuffled by column/row data
Code
import utils_pandas as upanda

cosine_sim_matrix = upanda.CosineSimilarityMatrix(funky_row_shuffled_df, start_column="column_000000", start_row="row_000000")
sorted_df = cosine_sim_matrix.sort(sort_columns = True, sort_rows = True)
fig = (px.imshow(sorted_df, width=1500, height=800, title="<b>Cosine-Similarity Sorted Pattern</b>"))#.show())
Image(fig.to_image())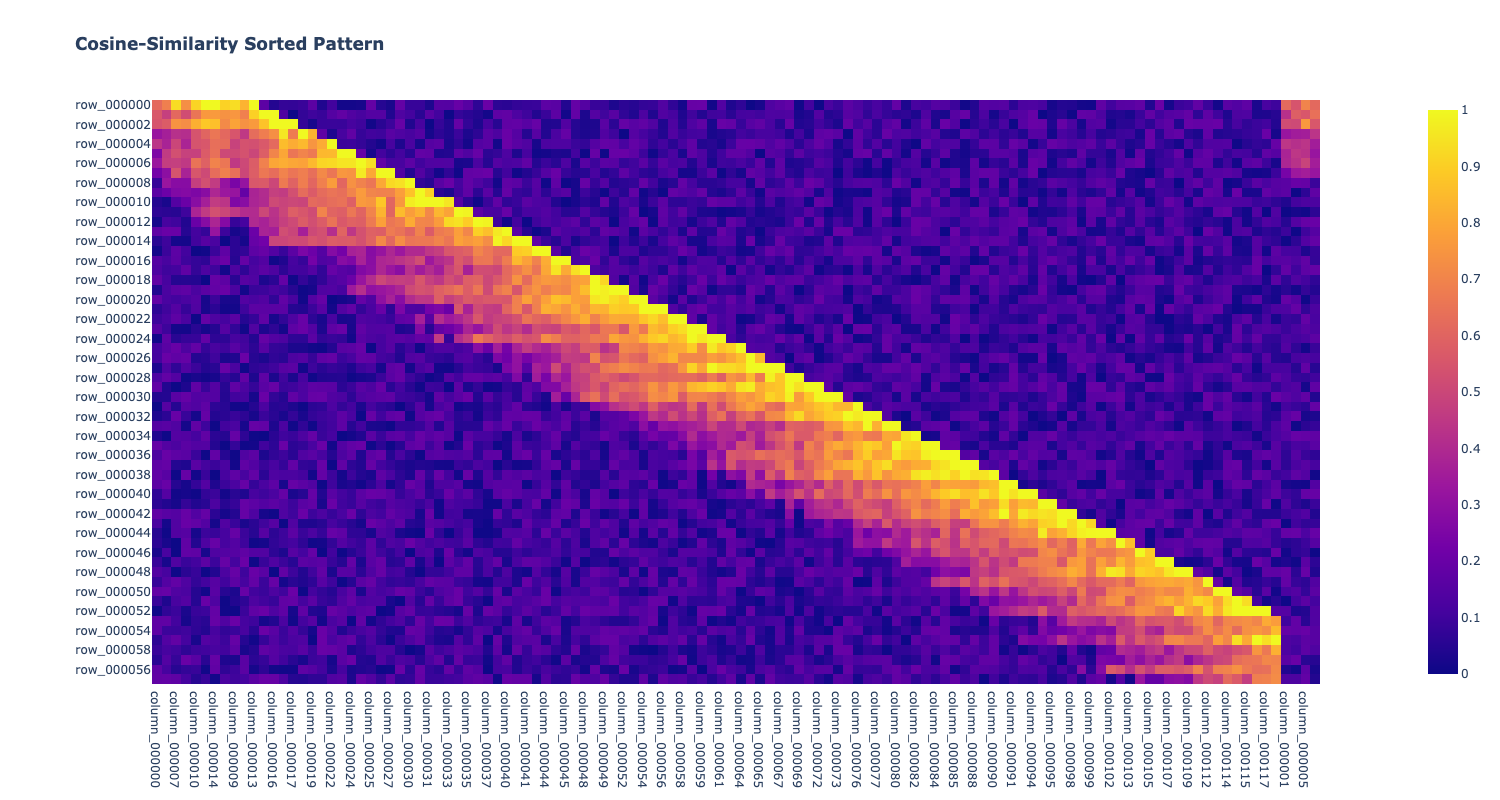
Not bad! The original row order was restored mostly - see how the row and column labels are (mostly) in lexigraphic order.