Khipu Fieldmarks
荃者所以在鱼,得鱼而忘荃
The fish trap exists, because of the fish. Once you have the fish, you can forget the trap.
言者所以在意,得意而忘言
Words exist, because of meaning. Once you have the meaning, you can forget the words.
吾安得夫忘言之,人而與之言哉
Where’s a man who has forgotten words, with whom I can talk?
庄子 Zhuang-Zi
Daoist (369 to ~300 BC) - Patron Tease of Decipherment.
0. Fieldmarks?

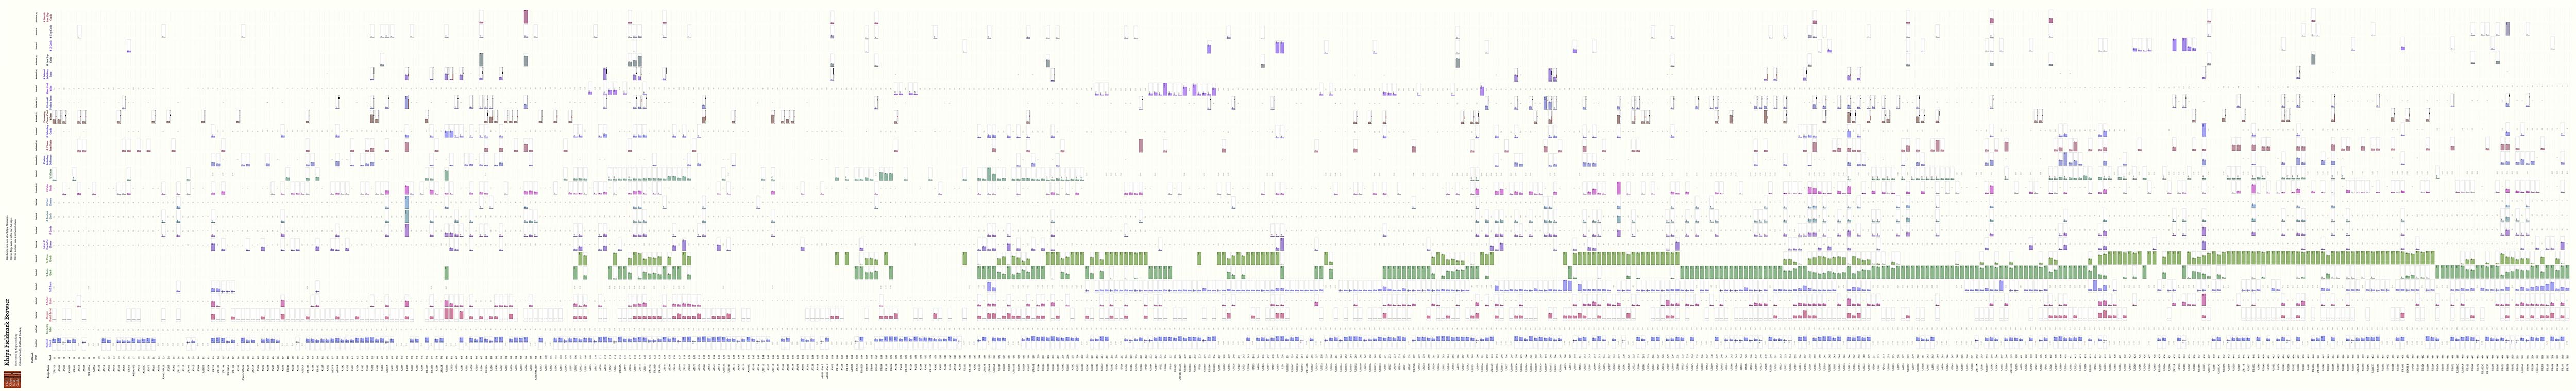
Khipu Fieldmark Graph.
Click on the image to open it in a new tab - then zoom and pan and see individual nodes.
In the new tab, use ⌘-F (Find) in your browser to search for a fieldmark or khipu.
A complex network analysis showing khipus in the Khipu Field Guide, and their relationship to various fieldmarks studied in this section. Khipu “nodes”, and fieldmark nodes are linked. Fieldmark nodes are linked to khipus which have significant values for that fieldmark. Khipus are linked to each other based on closest similarity. The network is segmented mathematically, based on the graph of nodes and edges, into communities that share a common set of edges, with a unique color for nodes and edges of a given community. Based on the presence and absence of fieldmark relationships, the graph algorithm has grouped 9 communities of khipus, denoted by various colors shown above.
The graph’s layout algorithm places similar fieldmarks near to each other. Khipus with a larger number of fieldmarks migrate to the center. Wallflowers - those khipus without significant fieldmarks other than being similar to another khipu, are on the periphery. This graphic guides the investigation of relationships - for example:
- Recto and Verso Attachments are close together and have some sort of relationship between them.
- %S Knots and % Z Knots are similarly close.
- Top Cords and Color Bands. Top Cords show up when khipus are largely color banded (i.e census khipus)
- Mean Cord Values Conversely, khipus with cord values in the 1,000 to 10,000 range are clearly in a class by themselves.
The great bird educator and ornithologist, Roger Tory Peterson, produced the first bird “field-guide” of the modern age. Rather than simply showing a picture of a bird, Peterson had arrows that pointed out key features of a particular bird to look for in identification. Intuitively, we know that shorebirds and hummingbirds have long bills. Petersen used patterns such as the bills’ curve type, or a unique leg color to identify a specific species or sex. Now known by biologists as Fieldmarks, the idea of key identification traits called fieldmarks provides the framework for this study.
Khipu fieldmarks are not “signs” in the conventional linguistic sense. Rather they are computational constructs that allow us to identify simple patterns in the khipu. Identifying and analyzing fieldmarks provides a few stepping stones to the day when we have a formal and complete khipu grammar. They also aid in machine learning classification, where the same idea of fieldmarks is referred to as “feature engineering”.
This study uses three key sources of fieldmarks:
- Statistical - The first source, Statistical, is based on the “raw” data extracted from khipus in the Khipu Field Guide. For example, khipus with very large cord values (in the range of 4,000 to 10,000) are most definitely in a class of their own. These khipus seem devoid of any other usual fieldmarks other than that they are indeed big.
- Relational - The second, is Relational and arithmetic. Marcia Ascher provides numerous observations on how cords sum over khipus. Examples include pendants summing other pendants, top cord sums of pendants, pendants summing across khipus by color, etc. From these observations, we can build basic relational fieldmarks. These ascher summation and order relationships occupy much of our study in this fieldguide. They are essential to the modern understanding of the majority of the khipu in the KhipuFieldGuide.
- Analytical - Lastly, fieldmarks can be Analytical, such as the Benford Match algorithm or the Hierarchical Clustering algorithm used to sort khipus by descriptive similarity. Analytical fieldmarks measure the khipu as a whole, and allow khipus to be compared with each other. These meta-level fieldmarks allow us to infer much about the existence and location of “natural language” in the Khipu FieldGuide.
Fieldmarks, also vary by scale. For example, pendant cords that are sums of other pendant cords in other groups, survey the entire khipu. Similarly, spatial arrangements of S and Z knots in astronomical khipus are patterns across the entire khipu. Fieldmarks like Ascher’s split-group sum match, where the sum of the left “half” of the group’s cords equals the sum of the right half, are viewed at the scale of a group.
What types of fieldmarks should be investigated? As examples, we can examine verso/recto cord attachments, or we could look for color and banding patterns (i.e. Manuel Medrano’s work), or summation patterns (i.e. Marcia Ascher’s detailed studies). Whenever there is something intriguing, and at a higher level than a simple knot or cord characteristic, it becomes noted as a potential fieldmark.
Despite the obvious enthusiasm I show for fieldmarks, I am cautious of reading too much into fieldmarks. I am reminded of the Swedish botanist Carl Linnaeus(1707-1778), history’s greatest typologist. After Linnaeus’ publication of plant systematics, Georges-Louis Leclerc, Comte de Buffon (1707–88) argued that Linnaeus’ classifications were simple heuristic devices incapable of revealing the real structure of nature. History proves them both right for different reasons. Analogously, fieldmarks are simple heuristic devices that allow us to infer a khipu grammar. They are not however, the grammar themselves.
It is also tempting to view absence of a fieldmark, or paucity of a fieldmark as significant. It is often not. I have discovered that many times metrics fail because we are dealing with 600 year old thread - thread that has been broken, frayed, mis-measured, and transcribed incorrectly. Although the khipu field guide presents drawings as “fact”, the fact is that the reconstructions can be partially or wholly wrong for a variety of reasons. Consequently, any metric leading us to believe that something is true, really has to be subsequently followed up on in the field and museums to be confirmed. Noisy data leads to noisy metrics.
1. The Khipu Fieldmark Browser
Click on The Khipu Fieldmark Browser to see how fieldmarks distribute across all the khipu in the Khipu Field Guide.
The Khipu Fieldmark Browser shows the fieldmarks for every khipu in the Khipu Field Guide. Khipus with a significant value for that fieldmark are shown with a box that describes the relative size value of that khipu. Khipus are row sorted (as the default order) by similarity to each other, and the columns are sorted by similarity to each other - for example the Number of Ascher Colors is likely to be correlated with the Number of Cords, and indeed, the sorting hat places the columns close to each other. Some fieldmark values such as decreasing cord value groups show a Handedness, appearing significantly on the left or right of the khipu. These khipus have fieldmarks with a lower bar showing the degree of handedness - indicated by a black/red thermometer.
You can click on a column header to sort the values for that column. For example you might want to see how the Number of Double Sum Top Cords correlates with the Number of Sum Top Cords. Click on the Number of Double Sum Top Cords to find out. The sorting respects those khipus without any Double Sum Top Cords and they remain in the order they were before we selected and sorted for Double Sum Top Cords.
2. Fieldmark List
Click on the Column Header Name to sort by that column.Click on the Fieldmark Name to see the in-depth page about that fieldmark.
Click on the Number of Significant Khipus link to see an image quilt of khipus with a significant quantity of that fieldmark.
| Fieldmark Name | Description | Type | Source | # Matching Khipus | # Significant Khipus |
|---|---|---|---|---|---|
| Number of Pendant Pendant Sum Cords | Pendant cords that are Sums of a set of Contiguous Pendant cords, regardless of color, or parent cord group. |
Relational Arithmetic (+) |
Ascher | 427 (66%) | 158 (24%) |
| Number of Pendant Cord Sums (by Color) | Pendant cords that are Sums of a set of Contiguous Pendant cords, with the Same Color, ignoring parent cord group boundaries. |
Relational Arithmetic (+) |
Ascher | 261 (40%) | 49 (7%) |
| Number of Indexed Pendant Sum Cords | Pendant cords that are Sums of Similarly Indexed cords in Contiguous Groups to the right or left of the cord. |
Relational Arithmetic (+) |
Ascher | 228 (35%) | 79 (12%) |
| Number of Subsidiary Pendant Sum Cords | Subsidiary cords that are Sums of Pendant cords right or left (inclusive) of the subsidiary cord. |
Relational Arithmetic (+) |
Ascher | 117 (18%) | 45 (7%) |
| Group Sum Bands | Number of groups whose left “half” sum equals the right “half” sum. Off-by-one loose matching is allowed. |
Relational Arithmetic (+) |
Ascher | 87 (13%) | 87 (13%) |
| Group Sum Pairs | Groups whose sum of all its cords, including subsidiaries, match the sum of another cluster in the khipu. |
Relational Arithmetic (+) |
Urton | 111 (17%) | 111 (17%) |
| Decreasing Group Cord Values | Groups whose cord values decrease from left to right. |
Relational Ordered (>) |
Ascher | 90 (14%) | 25 (4%) |
| Pendant Subsidiary Difference | Difference relation between the first pendant, it’s subsidiary, and the pendant’s neighbor, where the neighbor’s value equals the original pendant minus its subsidiary. |
Relational Arithmetic (-) |
Ascher | 145 (22%) | 77 (12%) |
| Number of Indexed Subsidiary Sum Cords | Subsidiary cords that are Sums of Similarly Indexed (by Color Index, not Position Index) cords in contiguous groups to the right or left of the cord. |
Relational Arithmetic (+) |
Ascher | 41 (6%) | 22 (4%) |
| Benford Match | Benford’s Law, AKA the first-digit law, is an observation about the frequency distribution of leading/first digits in many real-life sets of numerical data inventoried by humans. That allows us to distinguish “accounting” khipu from “narrative” khipu. | Analytical | Khosla | 639 (98%) | 447 (69%) |
| Hierarchical Clustering | Khipu arranged by similarity based on a lexical description of khipu structures and values | Analytical | Khosla | All (100%) | All (100%) |
| Deepest Branch Level | The level of subsidiary branching - 1 indicates at least one subsidiary. | Statistical | KFG | 382 (59%) | 255 (39%) |
| Number of Cord Groups | The number of cord clusters or groups residing on the primary cord. | Statistical | KFG | All (100%) | 67 (10%) |
| Mean Number of Cords Per Group | What is the average number of cords per group for the khipu. Some return 28. What could be 28 I wonder? :-) | Statistical | KFG | All (100%) | 115 (18%) |
| Number of Color Bands | The number of color bands of length 4 or more, in a khipu. | Statistical | KFG | 427 (66%) | 258 (40%) |
| Number of Ascher Colors | Each cord is assembled from various colors and then woven and tied in a solid, or barberpole, or mottled, etc … manner. This is described by an Ascher Color Operator. This metric returns the number of unique Ascher Color Operators for the khipu. | Statistical | KFG | 647 (99%) | 202 (31%) |
| Number of Cords | The total number of cords for the khipu, including top cords, subsidiary cords, etc. | Statistical | KFG | 647 (99%) | 202 (31%) |
| Mean Cord Value | The mean cord value of all the cords in the khipu. Khipus with really large cord values are in a class all their own. | Statistical | KFG | 623 (96%) | 24 (4%) |
| Number of Top Cords | The number of Top cords in a khipu. | Statistical | KFG | 47 (7%) | 47 (7%) |
| Number of Top Cord Sum Cords | Top cords, whose cord value is the sum of all cords in an adjacent group |
Relational Arithmetic (+) |
Locke | 29 (4%) | 29 (4%) |
|
Number of Top Cords Double Sum Cords |
Top cords, whose cord value is twice the sum of all cords in an adjacent group |
Relational Arithmetic (+) |
Ascher | 10 (2%) | 10 (2%) |
| Recto-attached Cords | Khipus with recto attached cords. | Statistical | KFG | 325 (50%) | 325 (50%) |
| Verso-attached Cords | Khipus with verso attached cords. | Statistical | KFG | 291 (45%) | 291 (45%) |
| Number of Z Cords | Khipus with Z-twisted cords. | Statistical | KFG | 80 (12%) | 80 (12%) |
| S Knotted Khipus | Khipus with S knots in their cords. | Statistical | KFG | 310 (48%) | 254 (39%) |
| Z Knotted Khipus | Khipus with Z knots in their cords. | Statistical | KFG | 387 (60%) | 314 (48%) |
3. Statistical Fieldmarks
Statistical features such as mean cord counts per group, or number of top cords per khipu are useful, when we map their distribution and decide what is significant (ie. in the top 1st standard deviation, or existence at all, or …). The process for deciding whether or not to include a statistical fieldmark is to view it’s distribution, look at it’s impact (i.e. the number of occurences) in the khipu database, and then decide what constitutes a significant presence or absence of that fieldmark.
The default test for significance for statistical fieldmarks, is to see if a khipu’s particular value for that mean lies above or below the mean. An example is Benford Match. For many statistical fieldmarks, however, the mean is close to zero. For example, the mean cord value for most cords lies close to 0, since so many cords are of 0 or 1 value. Consequently, for some statistical fieldmarks, what is significant is what lies well above the mean. For fieldmarks whose presence is rare (top cords are an example), simply the presence of the fieldmark means it’s significant. These fieldmark-specific significances are a part of the Khipu Fieldmark Browser’s implementation, when it decides which values for a given fieldmark deserve a box’ed/detailed representation.
A summarization of the analyses of statistical fieldmarks is on the Statistical Fieldmarks Overview page.
4. Relational Fieldmarks
4.1 Ascher Summation Patterns
An X-Ray View of KH0468’s pendant cords that sum other pendant cords.
In the Khipu FieldGuide - Introduction page, I briefly mentioned the Aschers, anthropologist Robert Ascher and mathematician Marcia Ascher, who wrote The Code of the Quipu.
Manuel Medrano suggested to me that Marcia Ascher’s observations be investigated in depth - This is the “simplest” (only mathematicians would say that LOL) kind of khipu analysis - being mostly analysis of sums and differences. As an example, Locke’s top cord sums would be an analysis of khipu sums. Other types of sum patterns exist as studied below. A somewhat dominant existing khipu narrative is that sums are expressed in top cords. My analysis of Ascher’s summation patterns show that that top cord sums are the exception, not the rule, and that the majority of summations in a khipu are of a pendant summing other pendant cords. Other summation patterns exist, almost all of them more prevalent than top cord sums.
These summation patterns are complicated, and often span across an entire khipu. Due to their complexity, a new type of data-visualization had to be created - cords are reduced to squares, and groups to columns of squares. These types of visualizations, called X-Ray Views, provide an easier path to deduce a khipu’s organization.
A summarization of the summation analysis is on the Ascher Sums Overview page.
Deterministic vs Statistical Approach
As a data-scientist, I prefer to model data predictions statistically. This is also the preferred technique when evaluating khipus, because of the destruction, breakage, inaccurate recording, etc. Khipu data is messy. However, when analyzing Ascher sum pattern we have to use a deterministic approach and search for sums that are (relatively) exact. Because of this noisy, lossy data, the search then becomes a hunt for fieldmark patterns that exhibit “significance” (occuring in many khipus, many times), and that seem to stand out amongst the noise.
4.2 Ascher Fieldmark Types
Because the study of sums is so large and detailed, a separate overview page is needed. A brief summary:
Fieldmarks from the Ascher relationships fall into the following categories
4.2.1. Group Fieldmarks/Relationships:
- Decreasing Cord Groups - Where a group’s cord values decrease from left to right
- Group Sum Matches - Where a group’s sum value of all cords matches another group’s sum value of all cords.
- Group Sum Bands - Where the “left” section of a group’s cords’ sums match the “right” section of a group’s cords’ sums.
4.2.2. Sum Fieldmarks/Relationships:
There are several types of sums relationships:
- Top Cords Sums that equal the sum of all cords in an adjacent group
- Top Cord Double Sums that equal the twice the sum of all the cords in an adjacent group
- Indexed Pendants Sums summing other indexed pendants. Sum cords whose value is the sum of similarly indexed cords in other groups (indexed by either color or position or both).
- Indexed Subsidiaries Sums summing other indexed subsidiaries.
- Pendants with Pendants Sums summing other pendants without similar indexes.
- Subsidiaries with Subsidiaries Sums summing other subsidiaries without similar indexes.
- Pendants and Subsidiaries Sums - the “outer product” of those two. (pendants and subsidiaries).
The investigation of ascher summation relationships reveals much about the structure and hierarchy of an overall khipu. When drawn using schematic techniques, as shown above, it offers an intriguing X-Ray View view of khipu and their Ascher Summation Relationships.
4.2.3. Difference Fieldmarks/Relationships:
Most differences can be read as adds 5 = 8 - 3 could be red as 8 = 5 + 3 and then interpreted differently by other means. However, Ascher notes specifically that differences are evident in cord and subsidiary for khipu KH0031.
4.2.4. Specific value Fieldmarks/Relationships:
Some relationships are of the form that X has some specific value. It’s hard to generalize this fieldmark. A more rewarding approach might be to simply sit with that khipu and look. :-)
When you look at the various types of Ascher fieldmarks, one has to ask Why so many ways to express sums and only one way to express differences?
5. Analytical Fieldmarks
Statistical and Relationship Fieldmarks compare features of individual khipus such as knots, and sums between cords. Analytical Fieldmarks compare khipus to one another as a whole, using metrics derived from the whole khipu, as opposed to individual parts of the khipu. Three methods of analysis exist:
Hierarchical Similarity: “Hierarchical Clustering” groups khipus that are similar together. We first saw an example of this in the Khipu Field Guide’s Khipu Analysis, where we converted khipu to their textual representation and then used textual machine learning techniques to cluster the data. Clustering, tried previously by Urton and Brezine (see Khipu Typologies in THEIR WAY OF WRITING - Scripts, Signs, and Pictographies in Pre-Columbian America by Boone & Urton), shows promise as an investigatory tool. The initial textual representation clustering showed that calendar khipus group together, for example. Other approaches were used to discover duplicate khipu. These approaches proved to be less successful.
Benford’s Law: Benford’s Law provides a metric for a khipu’s numerical values distribute - do a khipus values distribute randomly, or do they distribute in a human fashion (ie. lots of small digits for example, few large digits). Using Benford’s Law provides a surprising result and indicates that most khipus are of a human, numerical/accounting nature.
Zipf’s Law: Herman Zipf discovered that human language obeys certain distributional measures. For example, commonly used words, have shorter lengths than rarely used words; that is, word_length is inversely proportional to the frequency of the word being used. The distribution of human language by this measure is an inverse hyperbolic. We can use this fact to investigate khipus to see if they encode language.
A summarization of the analytical analyses is on the Analytical Overview page.
6. Investigations: Data Experiments
Numerous little “experiments” have been performed on the database, to investigate proposed theories about khipu construction. Sometimes these experiments are recreations of existing papers (ie. replicating the results of Brezzine and Urton’s work on the Purucucho Hierarchy). Other times, they are refutations of a proposed theory. Occasionally, serendipity arrives, and these little investigations spur advancement of a new line of decipherment. Together, these investigations provide a rich tapestry of approaches for khipu exploration and understanding.
7. Conclusions, Take-aways, and Next Steps
It’s been an interesting journey to analyze these three types of fieldmarks: statistical, relational, and analytical. Synthesizing the many bits of information into one big picture is provided on the Conclusions page.